Analytics section allows you to view your store’s sales data, product performance, customer behavior, and financial situation in the form of reports. This section helps you make data-driven decisions.
Analysis Terms Table
The following table explains how different metrics are calculated:
Term
Description
Gross Sales
Calculated by multiplying the sales price of products with the quantity ordered. Refunds, coupons, taxes, or shipping costs are not included.
Total Sales
The amount obtained after subtracting refunds and coupons from gross sales, and adding taxes and shipping costs.
Net Sales
The amount obtained after subtracting refunds and coupons from gross sales. Known as “Sales” in old WooCommerce reports.
Orders
The total number of new orders placed within the selected date range.
Average Order Value
Calculated by dividing the total sales amount by the number of orders.
Items Sold
Shows the total number of individual items sold.
Refunds
Displays the amount refunded in case of a product return.
Discounted Orders
Number of orders placed using coupons.
Net Discount Amount
Displays the total discount amount obtained from coupons.
Total Tax
The total amount of product tax and shipping tax applied to orders.
Order Tax
The total tax applied only to products in orders.
Shipping Tax
The total tax amount applied to shipping in orders.
Shipping
Shows the shipping charges related to the order or payment.
Downloads
Shows the total number of downloaded files.
4.1 – Overview
Displays a summary of all your store’s sales and orders.
You can quickly access important metrics such as total sales, number of orders, and average order value.
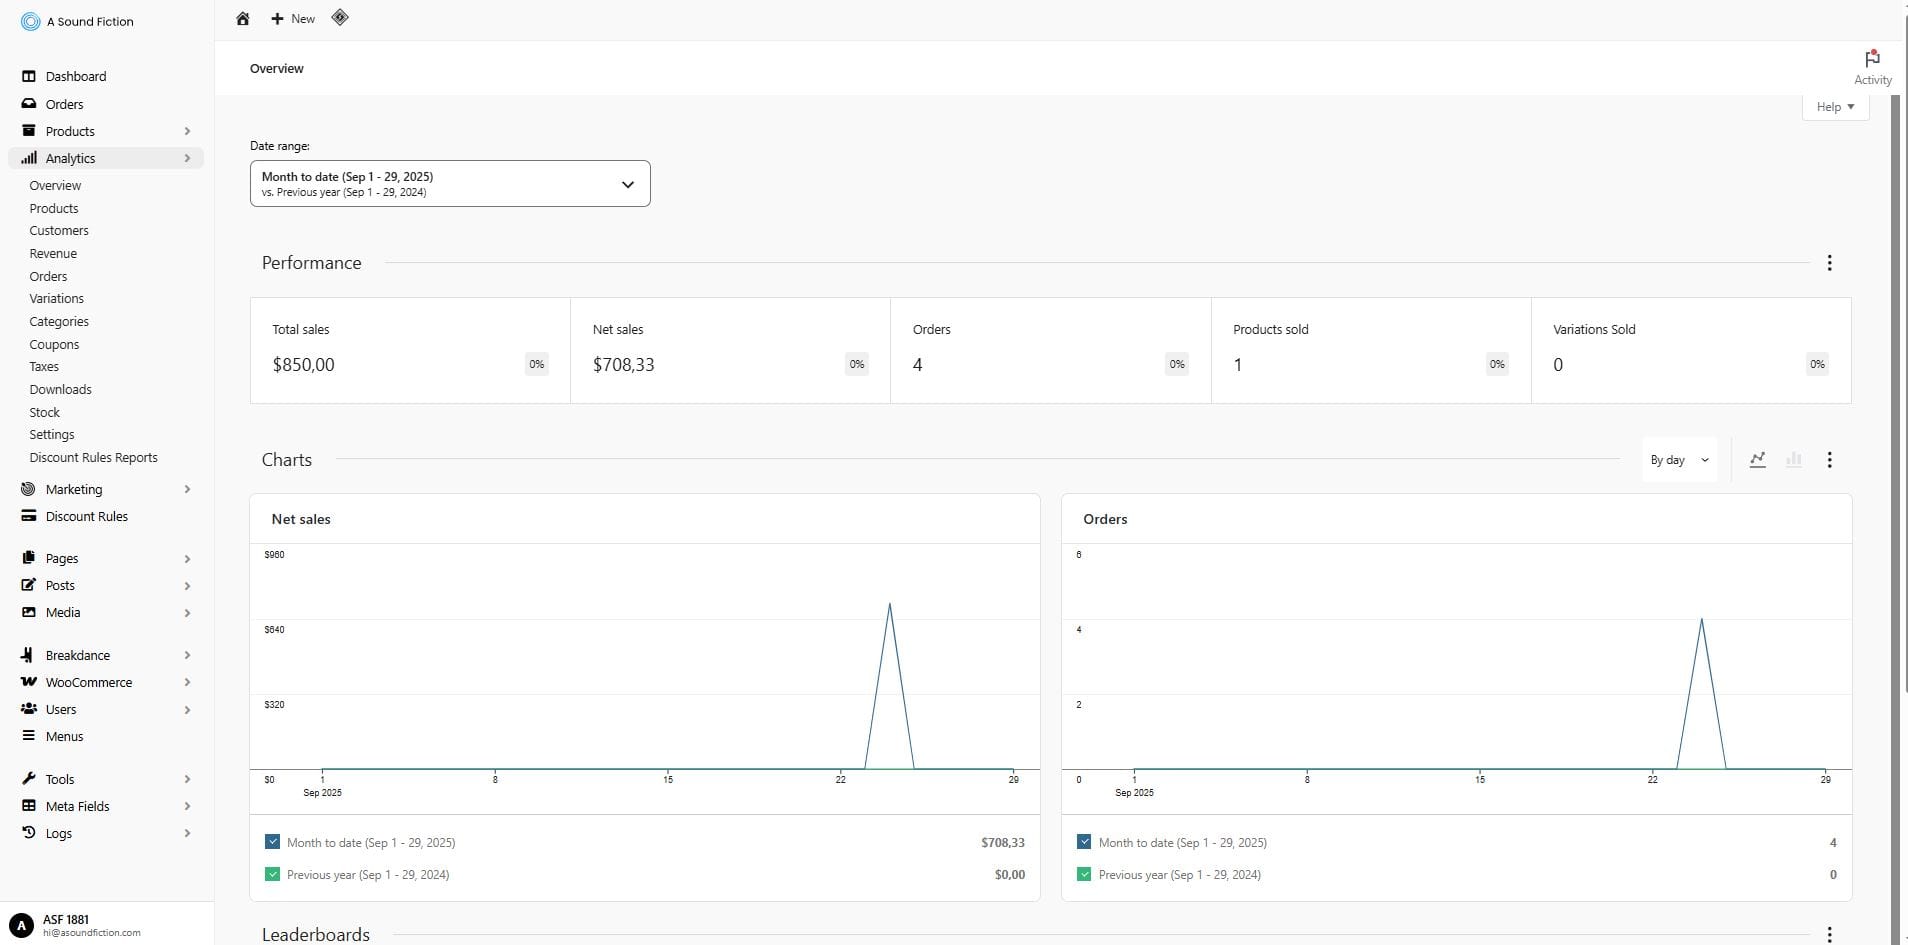
In this section, you can see the overall sales performance of your store.
Performance Area: Shows metrics such as total sales, net sales, number of orders, sold products, and variations.
Charts: Sales and order data can be viewed in graphical form.
Tip The user can examine performance for the desired period by selecting the date range. In addition, they can customize the charts’ view to shape reports according to their own needs.
4.1.1 – User Customizations
On the Overview screen, performance boxes and charts can be customized by the user according to their needs.
You can view reports for the desired period by changing the date range.
You can analyze charts on a daily, weekly, or monthly basis and adjust their view according to your preference.
Metrics in the performance area are automatically updated based on the selected date range.
Tip This way, each user can customize the panel according to their reporting needs.
4.1.2 – Activity Panel
The “🏳️ Activity” icon opens a notification panel that shows what is happening in your store. This panel is like a “live notification box” for your store. From new orders to performance reports, you can see important updates here from a single screen.
Click on the “Analytics > Overview” option from the admin panel on the left side.
Click on the “🏳️Activity” icon at the top right section.
4.2 – Products
In this section, you can see the performance of the products sold in your store and access detailed reports. The panel offers both visual charts (line and column charts) and detailed tables.
a)Top Section Special Boxes
Sold Products and Net Sales: In the top section of the panel, you can see how many products were sold in the selected date range, the total net sales amount, and how many orders were created.
From the Date Range box located at the top of the panel, you can choose the period you want to see. You can select daily, weekly, monthly, or yearly ranges. You can also define custom date ranges to view only specific periods’ sales data.
Next to the date range, you can select from the Show menu which products will appear in the report:
All Products: Shows the sales data of all products in your store.
Single Product: Brings only the sales and order data of the selected product.
Comparison: Allows you to compare two or more products side by side.
Charts:
Line charts show how sales progress over time.
Column charts allow you to compare products comparatively.
You can change the chart type from the icons located at the top right.
b) Chart Area and Data Download
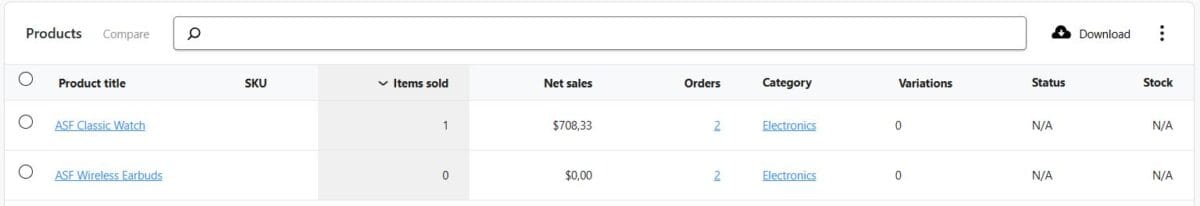
Product Table: The following information is listed for each product in the table below:
Product title
SKU
Quantity sold
Net sales amount
Number of orders
Category, variation, stock, and status information
Data Download: By clicking the download icon at the top right, you can download the report as a CSV file to your computer and open it in Excel or other reporting tools.
Click on the “Analytics > Products” option from the admin panel on the left.
Go to the “Products” table at the bottom of the page. Click the “⋮” icon on the far right of the table to adjust the columns you want to see.
Click the “Download” button next to it and download your data.
Tip This way, both the shop manager and the finance team can easily analyze sales performance using different tools.
4.3 – Customers
In the Customers section, you can see all customers who registered on your site or placed orders as guests. You can access details such as customers’ order history, total spending, and contact information here.
a)Advanced Filtering
By using the filtering feature, you can narrow down your orders.
Click on the “Analytics > Customers” option from the admin panel on the left side.
Click on the tab under the “Show” heading at the top of the page.
In the panel that opens, select the “Advanced filters” option.
Click the “+ Add filter” button and choose your filter option (in our example, “Email”).
Click the “Filter” button.
b) Data Download
The Customer Table allows you to see your customers’ shopping habits, identify the users who spend the most, and shape your marketing strategies based on this data. You can download this data to your computer in “CSV” format.
Name: Displays the customer’s name or the registered username in the system. In guest checkouts, the label “Guest” appears.
Username: Shows the registered customer’s username. This field remains empty for guests.
Last Active: The date when the customer last logged in to the site or placed an order.
Date Registered: The date the customer registered in the system. For guest customers, this field may be empty.
Email: The email address the customer uses for communication. This address can be used for order notifications and marketing campaigns.
Orders: Shows the total number of orders placed by the customer.
Total Spend: The total amount spent by the customer.
AOV (Average Order Value): The average order value, i.e., the average amount of the customer’s orders.
Country/Region, City, Region, Postal Code: The billing or shipping address details of the customer.
To download the data:
Click on the “Analytics > Customers” option from the admin panel on the left side.
Go to the “Customers” table at the bottom of the page. Click on the “⋮” icon located on the right side of the table to adjust which columns you want to display.
Click the “Download” button next to it and download your data.
4.4 – Revenue
This panel summarizes all income and expenses of your store within the selected date range. It not only considers sales figures but also includes taxes, refunds, coupon discounts, and shipping fees to present you with a clear net revenue table. The panel provides both visual charts (line and bar graphs) and detailed tables.
a)Top Section Special Boxes
Gross Sales: The total sales amount invoiced to customers, including taxes and shipping.
Returns: Displays the refund amounts for returned products.
Coupons: The total value of applied discount coupons.
Net Sales: The amount remaining after deducting refunds and discounts from gross sales.
Taxes: The total tax amount applied to sales.
Shipping: Revenue earned from shipping charges (if applicable).
Total Sales: The overall total after including all items.
b) Chart Area and Data Download
With this screen, you can track your sales daily, weekly, or monthly, review the charts, and download the table as a CSV file. To download the data:
Click on the “Analytics > Revenue” option from the admin panel on the left.
Go to the “Revenue” table at the bottom of the page. Click on the “:**” icon on the far right of the table to adjust which columns you want to see in your table.
Click on the “Download” button next to it and download your data.
4.5 – Orders
The Orders section allows you to view the orders placed on your site numerically and examine them in detail. Here, you can track the number of orders, net sales amount, average order value, and the average number of products per order. The panel provides both visual charts (line and bar graphs) and detailed tables.
a)Top Section Summary Boxes
Orders: Shows the total number of orders placed within the selected date range.
Net Sales: Displays the actual sales amount after deducting refunds and coupon discounts.
Average Order Value: Shows the average monetary value of each order.
Average Products per Order: Lists how many products were sold on average in each order.
Example: In the visual, there are 4 orders, but due to refunds, the net sales appear as $708.33.
b)Advanced Filtering
By using the filtering feature, you can narrow down your orders.
In the admin panel on the left, click on “Analytics > Orders”.
At the top of the page, click on the tab under the “Show” heading.
In the panel that opens, select the “Advanced Filters” option.
Click the “+ Add Filter” button and choose your filter option (in our example, “Refund”).
Click the “Filter” button.
c)Chart Area and Data Download
Through this screen, you can track your orders on a daily, weekly, or monthly basis, review charts, and download the table as a CSV file. Here, you can review individual order details.
Date: The date the order was placed.
Order: Clicking the order number redirects you to the order detail page.
Status: The current status of the order (e.g., Pending, Processing, Completed, Refunded).
Customer type: The name of the person who placed the order and whether they are registered in the system or new.
Products: The list of products included in the order.
Items sold: Indicates the total number of items in the order.
Coupon(s): Displays any coupon used in the order.
Net sales: The net sales amount of the relevant order.
Attribution: Additional information related to the order (e.g., Unknown, store source, etc.).
To download the data:
In the admin panel on the left, click on “Analytics > Orders”.
Scroll down to the “Orders” table at the bottom of the page. On the far right of the table, click the “⋮” icon to adjust which columns are displayed.
Click the “Download” button next to it and download your data.
4.6 – Variations
The Variations section allows you to track the sales performance of different variations of your products (e.g., size, color, model). From the top section, you can select a desired date range to analyze variation sales only within specific days/weeks/months.
Display Panel:
All variations → Lists the sales of all product variations collectively.
Single variation → Displays the performance of only the selected single variation (in our example “ASF Laptop – 500 GB”).
Comparison → Allows you to compare multiple variations side by side.
Advanced filters → Lets you review detailed filtering options for specific product groups.
a)Top Section Summary Boxes
The panel provides both visual charts (line and bar charts) and detailed tables.
Sold Products: Indicates the total number of products sold in the order.
Net Sales: Shows the actual sales amount after returns and coupon discounts are deducted.
Orders: Displays the total number of orders placed within the selected date range.
b)Advanced Filtering
By using the filtering feature, you can narrow down your orders.
In the admin panel on the left, click the “Analytics > Variations” option.
At the top of the page, click the tab under the “Show” heading.
In the panel that opens, select the “Advanced filters” option.
Click the “+ Add filter” button and select your filter option (in our example “Product Category: Laptop”).
Click the “Filter” button.
c)Chart Area and Data Download
In this section, you can use the table to see your sales performance in detail. Each column displays different information:
Product/Variation Title: The name of the product or variation (example: T-Shirt – M – Black). This shows which model of the product was sold.
SKU: The uniquely defined stock number for the product. It is used to distinguish each product in your store.
Items Sold: Shows how many units of the product or variation were sold during the selected date range.
Net Sales: Revenue generated from product sales (excluding taxes and returns).
Orders: Shows how many different orders the product was included in.
Status: This field shows whether the variation is available for sale or not.
Stock: Indicates how many units of the product or variation are currently left in stock.
Tip By examining this table, you can immediately see which product is selling the most and which product’s stock is running low.
To download the data:
In the admin panel on the left, click the “Analytics > Variations” option.
Scroll down to the “Variations” table at the bottom of the page. Click on the “⋮” icon on the far right of the table to customize which columns to display in your table.
Click the “Download” button next to it and download your data.
4.7 – Categories
In the Categories section, you can examine product sales by categories. You can easily see which product group (e.g., “Computer” or “Laptop”) sold more and generated more revenue. From the top box, you can select the desired date range to view only the sales of a specific period.
Display Panel:
All Categories: Displays the total sales and performance data of all product categories.
Single Category: Allows you to view the detailed sales data of only the selected category.
Comparison: Enables you to compare the performance of two or more categories side by side.
Tip This way, you can either view the overall table, examine a single category, or compare categories side by side.
a)Top Section Summary Boxes
The panel provides both visual charts (line and bar charts) as well as detailed tables.
Sold Products: Indicates the total number of products in the order.
Net Sales: Shows the actual sales amount after deducting returns and coupon discounts.
Orders: Displays the total number of orders placed within the selected date range.
b)Chart Area and Data Download
The Categories table summarizes the sales and revenue performance for each category within the selected date range. Here you can easily see which category sold more products, how much revenue it generated, and how many orders were placed. In this table:
Category: The name of the category the products belong to (e.g., General, Computer, Laptop).
Items sold: Total number of sales for this category.
Net sales: Revenue generated from sales.
Products: Number of products associated with this category.
Orders: Number of orders placed in this category.
To download the data:
From the admin panel on the left, click on the “Analytics > Categories” option.
Go to the “Categories” table located at the bottom of the page. Click the “⋮” icon on the far right of the table to adjust the columns you want to see in your table.
Click the “Download” button next to it and download your data.
4.8 – Coupons
The Coupons section allows you to track the performance of discount coupons used in your store. Here, you can see in detail how many times each coupon has been used, the total discount provided, and in which orders the coupons were applied. You can also filter the relevant data according to the date range you want (e.g., daily, monthly, yearly).
Display Panel:
All Coupons: Shows the total impact of all coupons created in your store. For example, how many orders used a coupon in total and how much discount was given.
Single Coupon: Allows you to examine the performance of a specific coupon (e.g., asf1881) separately. This way, you can track the discount amount and order counts specific to that coupon.
Comparison: Lets you compare multiple coupons at the same time, showing which coupon was used in more orders or provided a higher discount.
Example: In the panel, the coupon “asf1881” was used in 1 order and provided a discount of $83,33. With the “Single Coupon” option, you can focus only on that coupon, while with the “All Coupons” option, you can view the total table together with other coupons.
a)Top Section Summary Boxes
The panel provides both visual charts (line and bar charts) and detailed tables.
Discounted Orders: Shows the total number of orders placed using coupons.
Amount: Displays the total discount provided by coupons in $.
b)Chart Area and Data Download
The Coupons Table shows the performance and key information of the coupons created in your store. You can find what each column represents below:
Coupon code: Displays the name/code of the coupon used.
Orders: Indicates how many orders the coupon was used in.
Amount discounted: Shows the total discount amount provided by the coupon.
Created: Indicates when the coupon was created.
Expires: Shows whether the coupon has an expiration date.
Type: Specifies the type of coupon (e.g., fixed discount, percentage discount, free shipping, etc.).
To download the data:
In the admin panel on the left, click “Analytics > Coupons“.
Go to the “Coupons” table at the bottom of the page. Click the “⋮” icon on the far right of the table to adjust the columns you want to see.
Click the “Download” button next to it and download the data.
4.9 – Taxes
The Taxes section allows you to review in detail the taxes collected on sales made through your store. The panel shows both the overall totals and the details separately according to each tax class.
a)Top Section Summary Boxes
The panel provides both visual charts (line and bar charts) and detailed tables.
Total Tax: Shows the total of all taxes collected within the selected date range.
Order Tax: Displays the tax derived from product sales.
Shipping Tax: Indicates the tax applied to the shipping fee.
Orders: Shows how many orders these taxes were calculated from.
For example: A total tax of $695,00 has been collected from 6 order. Since there was no shipping tax, this field shows $0.00.
b)Chart Area and Data Download
The tax table lists the following information:
Tax Code: Displays the name of the tax class (e.g., 1% VAT, 20% VAT).
Rate: The applied tax percentage.
Total Tax: The total amount of tax collected according to that rate.
Order Tax: The tax calculated on product sales.
Shipping Tax: The tax applied to the shipping cost.
Orders: Shows how many orders this tax rate was applied to.
For example: In the table, $141,67 of tax was collected for 20% VAT, applied across 4 orders.
To download the data:
From the admin panel on the left, click “Analytics > Taxes“.
Go to the “Taxes” table at the bottom of the page. Click on the “⋮” icon on the far right of the table to customize the columns displayed.
Click the “Download” button next to it and download your data.
4.10 – Downloads
The Downloads section is only actively used in stores that sell digital products. For example; when you sell products such as e-books, PDF reports, software files, music, or images, your customer downloads these files after placing the order. The Downloads panel shows which files your customers downloaded, how many times, on which dates, and from which IP address.
a)Top Section Summary Boxes
The panel provides both visual charts (line and bar charts) and detailed tables.
b)Chart Area
The information listed in this section includes:
Date: The date the download was made.
Product Title: The name of the downloaded product.
File Name: The name of the downloaded file.
Order: The order through which the file was downloaded.
Username: The name of the customer who downloaded it.
IP: The IP address of the device where the download was made.
To manage the indicators in the downloads table:
Click on the “Analysis > Downloads” option from the admin panel on the left.
Go to the “Downloads” table located at the bottom of the page. Click on the “⋮” icon located at the far right of the table to adjust the columns you want to see in your table.
4.11 – Stock
In the Stock section, you can track the stock status of your products from a single screen. You can see which products are running low, which products are out of stock, and which products are still available.
a) Display Panel
Thanks to the dropdown menu at the top right, you can filter the products you only want to see:
All Products: Shows all products registered in the system.
Out of Stock: Lists products that are completely sold out.
Low Stock: Displays products with decreased stock (you set the limit values).
In Stock: Lists products that are still available for sale.
On Backorder: Shows products whose sales have been completed.
b)Chart Area and Data Download
The information listed in this section includes:
Product / Variation: The name of the product whose stock status you want to check is listed.
Stock Code (SKU): The code you have assigned specifically to the product is shown here.
Status: The product is shown with statuses such as “In Stock,” “Out of Stock,” or “Low Stock.”
Stock: You can clearly see the quantity of stock left (for example: if it says “3,” it means you have 3 items left in stock).
To download the data:
From the left admin panel, click on “Analytics > Stock“.
Go to the “Stock” table at the bottom of the page. Click on the “⋮” icon on the far right of the table to adjust the columns you want to see.
Click the “Download” button next to it and download your data.
4.12 – Settings
In the Settings section, you can define which order statuses will be taken into account in the reports and set the default date ranges. This way, you have full control over which orders will be reflected in your reports. To make changes in this section:
From the admin panel on the left, click on “Analytics > Settings”.
Make the desired changes in the settings.
At the bottom of the page, click on the “Save Settings” button.
Tip These settings determine which orders will appear in the reports. Incorrect changes may distort the results. Therefore, only modify this area under the instruction of your administrator.
a) Excluded Statuses
Orders with these statuses will be excluded from the totals in your reports. The status Refunded cannot be excluded.
Example: If you select Cancelled or Failed, these orders will not be reflected in your sales reports.
Tip Unregistered statuses: The statuses marked here (e.g., Trash or Auto Draft) will not be included in reports. These are usually temporary or deleted orders.
b) Actionable Statuses
Orders with these statuses require action by the store manager. These orders will appear in the Main Screen – Orders task.
Tip Unregistered statuses: The statuses marked here (e.g., Trash or Auto Draft) will not be included in reports. These are usually temporary or deleted orders.
c) Default Date Range
You can choose which date range will be displayed when reports are opened.
Example: When you select Daily, Weekly, or Monthly, the reports will be automatically prepared for that period.
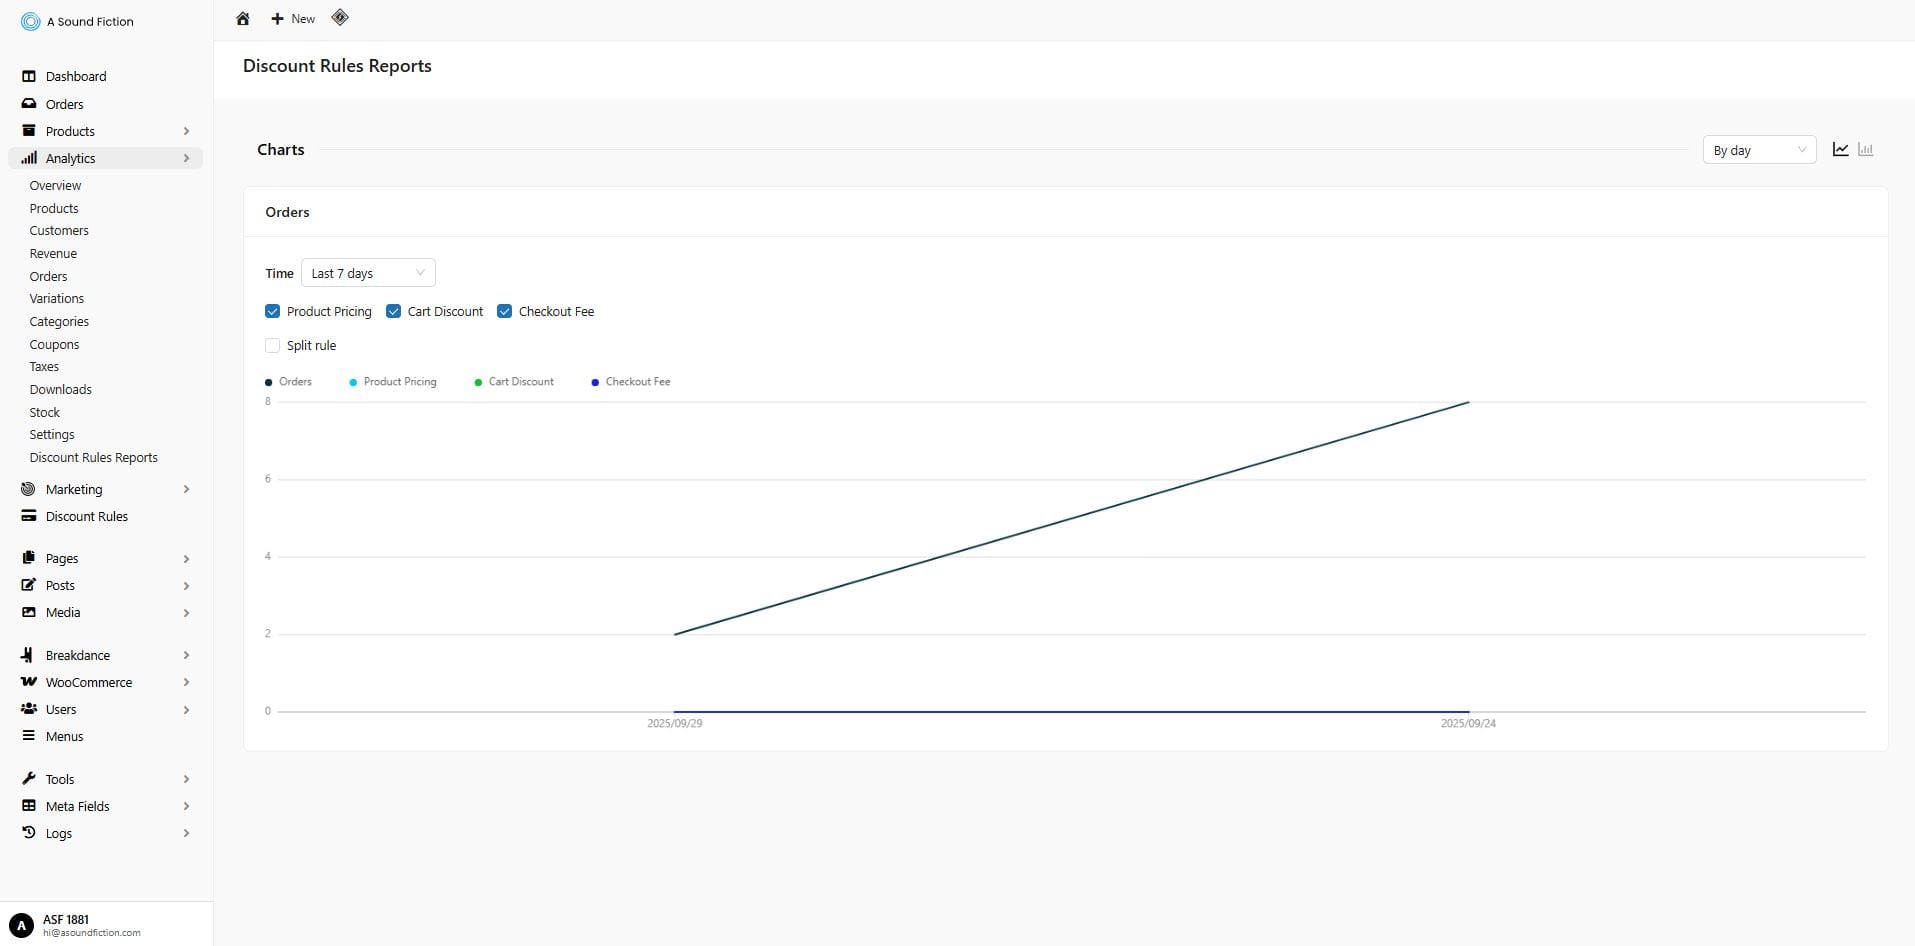
4.13 – Campaign Reports
The Campaign Reports section allows you to see how your campaigns, discounts, and promotions impact your store’s sales. Thanks to charts, you can easily track all details such as coupon usage, product-based discounts, or additional fees during the checkout process.
Time Selection (Last 7 days, Today, This Month, etc.): Allows you to specify the date range in which campaigns will be analyzed.
Campaign Types (Product Pricing, Cart Discount, Payment Fee, Split Rule): Enables you to select the campaign type and view reports specifically for that type.
Charts: You can see the change in sales over time with a line chart and visually monitor performance.
Can't find the answers you're looking for? We're here to help.
We Ask for Your Consent for a Better Experience We use cookies to ensure our website functions properly, personalize content and ads, provide social media features, and analyze site traffic. We also share information about your use of the site with our social media, advertising, and analytics partners.
Functional
Always active
Technical storage or access is strictly necessary for a legitimate purpose in order to provide a specific service explicitly requested by the subscriber or user, or to transmit a communication over an electronic communications network.
Tercihler
Teknik depolama veya erişim, abone veya kullanıcı tarafından talep edilmeyen tercihlerin saklanmasının meşru amacı için gereklidir.
Statistics
These cookies help us optimize our website. By allowing us to use these cookies, we can learn which pages our users enjoy browsing the most and which products are the most popular. Some of these cookies are provided by companies located outside the country. If you enable the use of these cookies, your personal data processed through the cookies will be transferred abroad.These cookies help us optimize our website. By allowing us to use these cookies, we can gain insights into which pages our users enjoy visiting the most and which products are the most popular. Some of the providers of these cookies are located abroad. If you enable the use of these cookies, your personal data processed through cookies will be transferred abroad.
Marketing
These cookies are used to help prevent you from seeing irrelevant ads. They are also used to display A Sound Fiction ads based on the products you browse, search for, or purchase when visiting other websites. Some of the providers of these cookies are located outside the country. If you enable the use of these cookies, your personal data processed through the cookies will be transferred abroad.